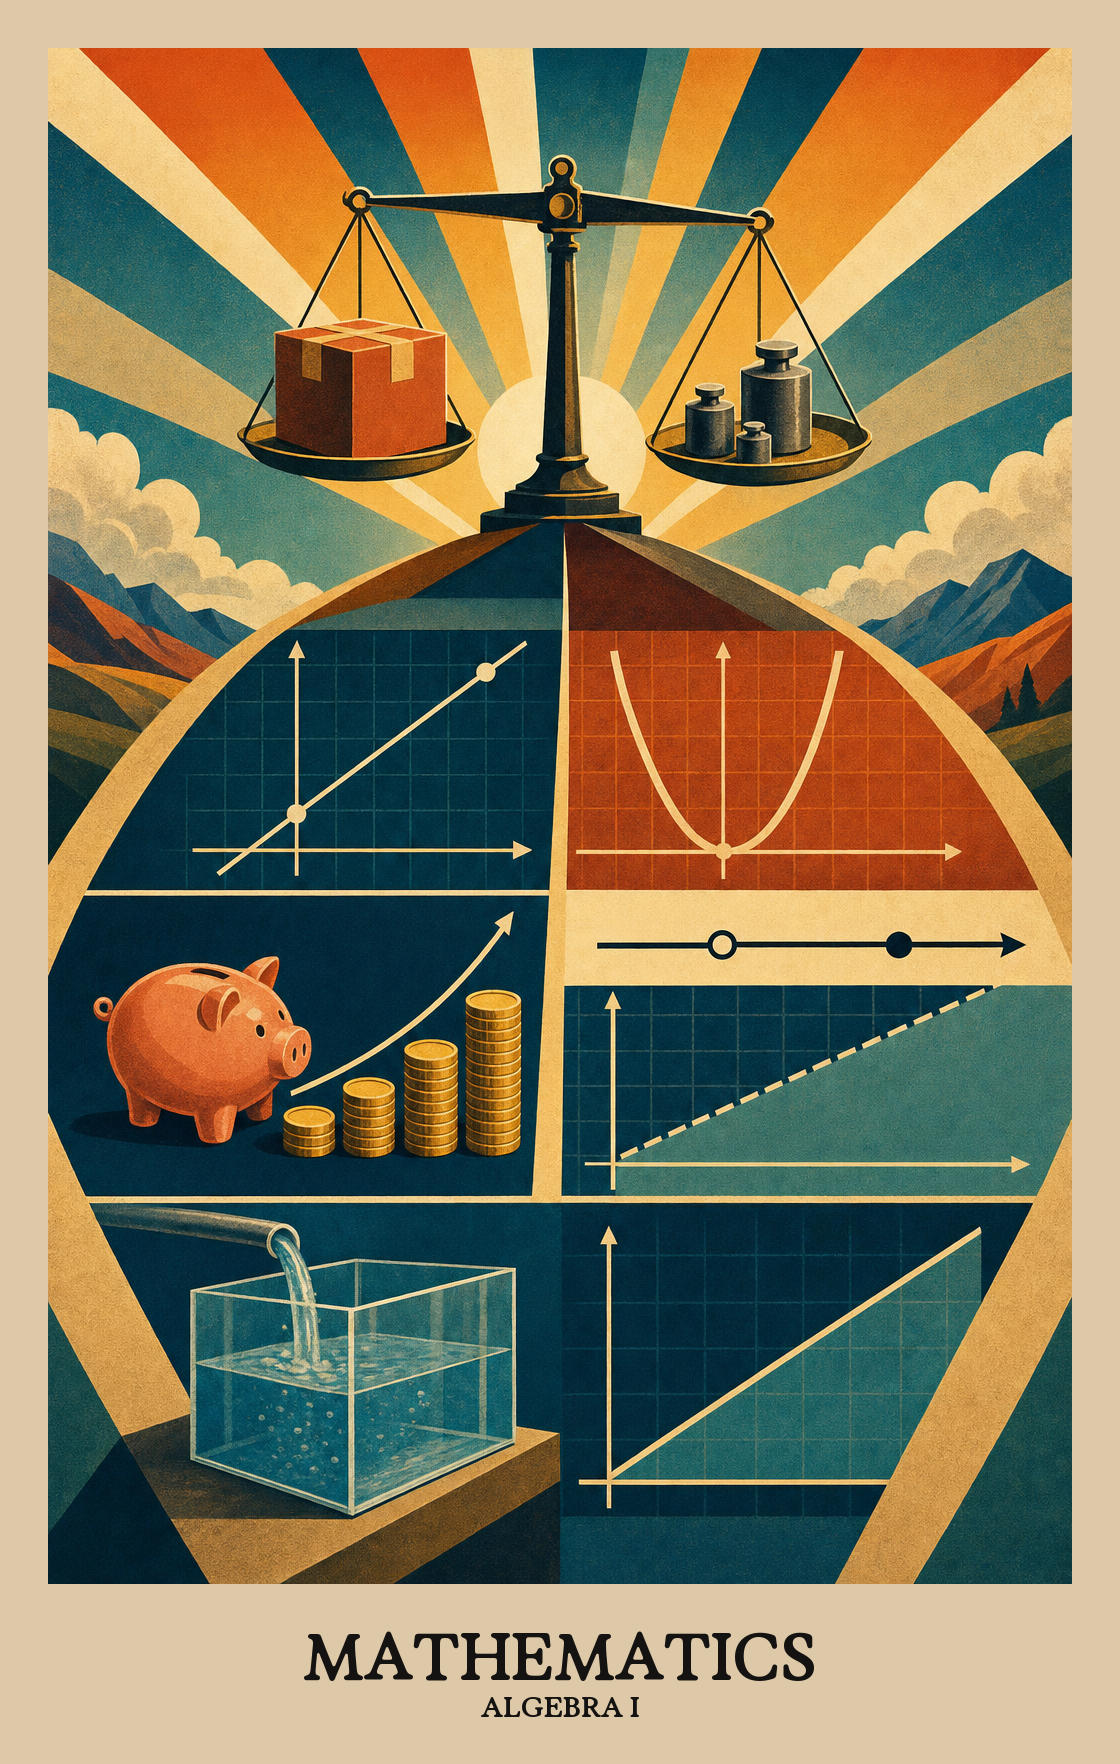
This is the year math stops being arithmetic and starts being algebra. Students learn to write equations and inequalities that describe real situations, then graph them to see what the answers look like. They work with three big families of functions: lines, parabolas, and exponential growth like money in a savings account. By spring, students can solve for x in a real word problem and sketch the graph that goes with it.
How the year usually goes. Every school and district set their own curriculum, so treat this as a guide, not official pacing.
1
Linear equations and inequalities
Students start the year working with straight-line relationships. They write equations from word problems, solve for missing values, and graph lines that show how one quantity changes with another, like cost over time.
2
Systems of equations
Students work with two equations at once and find the point where both are true. Parents may see problems about comparing two phone plans or figuring out when two savings accounts reach the same amount.
3
Polynomials and factoring
Students add, subtract, and multiply expressions with variables, then practice factoring them back apart. This is the toolkit they need before working with curved graphs in the next phase.
4
Quadratic functions
Students study U-shaped graphs and the equations behind them. They find the highest or lowest point, the points where the curve crosses zero, and use these to model things like the path of a thrown ball.
5
Exponential growth and decay
Students close the year with quantities that grow or shrink by a percent each step, like money earning interest or a population doubling. They compare these curves with the straight lines and parabolas from earlier.
Mastery Learning Standards
The required skills a student should display by the end of Grade 11.
When a math problem gets hard, students try a different approach instead of giving up. They look for patterns, rethink what they know, and keep working until they find a path forward.
Students solve problems with practiced efficiency, choosing methods that get to the answer cleanly. The focus is on knowing the steps well enough that the work itself doesn't slow the thinking down.
Students talk through math problems with classmates, asking questions when something is unclear and explaining their own thinking out loud. The goal is to sharpen everyone's understanding, not just get to the right answer.
Students look for patterns and repeated structure to figure out how a problem works before choosing a method to solve it. Recognizing what stays the same across different problems helps students work more efficiently and catch mistakes early.
Students check whether their answer actually makes sense for the situation. That means asking if the number is in the right ballpark, the units fit, and any rounding did not send the answer in the wrong direction.
Students use algebra to work through real problems, like figuring out costs, distances, or rates. The math isn't just practice on paper; it connects to decisions students actually face or will face.
When a math problem gets stuck, students slow down, try a different method, and keep going until something works. They treat wrong turns as part of the process, not a reason to quit.
Students take a real situation (a rising cost, a shrinking population, a cooling cup of coffee) and build a math model that describes it. The goal is a formula or graph that makes the situation easier to analyze and predict.
Students talk through math problems with classmates, asking questions when something is unclear and explaining their own thinking out loud. The goal is sharper understanding, not just a right answer.
Students look for patterns and structure in a problem before diving into the math. Spotting how a problem is put together often reveals a faster or clearer path to the answer.
Students check whether an answer actually makes sense for the situation. That means asking if the number is in the right ballpark, the units fit (miles, dollars, seconds), and any rounding didn't push the result too far off.
Students use algebra to work through real problems: figuring out costs, making predictions, or deciding between options. The math connects to situations outside of class, not just exercises on a page.
Students take a real situation (a shrinking glacier, a growing savings account) and build a math model that describes it: an equation, a graph, or a diagram. The model lets them make predictions or decisions based on actual data.
Students solve problems using methods that are both accurate and efficient. When multiple approaches exist, students choose the one that gets to the answer with less unnecessary work.
Students talk through math problems with classmates, asking questions when something is unclear and explaining their own thinking when others need help.
Students look for patterns and repeated structures to make sense of a problem before solving it. Recognizing how a shape, equation, or diagram is built helps students find a faster or cleaner path to the answer.
Students check whether an answer makes sense in real life. That means asking if a measurement, estimate, or rounded number fits the situation before accepting it as correct.
Students use geometry skills to solve problems they'd actually encounter outside school, like figuring out measurements, layouts, or designs in everyday situations.
Standard
Definition
Code
Mathematical Thinking
Algebra I
When a math problem gets hard, students try a different approach instead of giving up. They look for patterns, rethink what they know, and keep working until they find a path forward.
Students solve problems with practiced efficiency, choosing methods that get to the answer cleanly. The focus is on knowing the steps well enough that the work itself doesn't slow the thinking down.
Students talk through math problems with classmates, asking questions when something is unclear and explaining their own thinking out loud. The goal is to sharpen everyone's understanding, not just get to the right answer.
Students look for patterns and repeated structure to figure out how a problem works before choosing a method to solve it. Recognizing what stays the same across different problems helps students work more efficiently and catch mistakes early.
Students check whether their answer actually makes sense for the situation. That means asking if the number is in the right ballpark, the units fit, and any rounding did not send the answer in the wrong direction.
Students use algebra to work through real problems, like figuring out costs, distances, or rates. The math isn't just practice on paper; it connects to decisions students actually face or will face.
When a math problem gets stuck, students slow down, try a different method, and keep going until something works. They treat wrong turns as part of the process, not a reason to quit.
Students take a real situation (a rising cost, a shrinking population, a cooling cup of coffee) and build a math model that describes it. The goal is a formula or graph that makes the situation easier to analyze and predict.
Students talk through math problems with classmates, asking questions when something is unclear and explaining their own thinking out loud. The goal is sharper understanding, not just a right answer.
Students look for patterns and structure in a problem before diving into the math. Spotting how a problem is put together often reveals a faster or clearer path to the answer.
Students check whether an answer actually makes sense for the situation. That means asking if the number is in the right ballpark, the units fit (miles, dollars, seconds), and any rounding didn't push the result too far off.
Students use algebra to work through real problems: figuring out costs, making predictions, or deciding between options. The math connects to situations outside of class, not just exercises on a page.
Students take a real situation (a shrinking glacier, a growing savings account) and build a math model that describes it: an equation, a graph, or a diagram. The model lets them make predictions or decisions based on actual data.
Students solve problems using methods that are both accurate and efficient. When multiple approaches exist, students choose the one that gets to the answer with less unnecessary work.
Students talk through math problems with classmates, asking questions when something is unclear and explaining their own thinking when others need help.
Students look for patterns and repeated structures to make sense of a problem before solving it. Recognizing how a shape, equation, or diagram is built helps students find a faster or cleaner path to the answer.
Students check whether an answer makes sense in real life. That means asking if a measurement, estimate, or rounded number fits the situation before accepting it as correct.
Students use geometry skills to solve problems they'd actually encounter outside school, like figuring out measurements, layouts, or designs in everyday situations.
When a math problem gets hard, students try a different approach instead of giving up. They look for patterns, rethink what they know, and keep working until they find a path forward.
Students solve problems with practiced efficiency, choosing methods that get to the answer cleanly. The focus is on knowing the steps well enough that the work itself doesn't slow the thinking down.
Students talk through math problems with classmates, asking questions when something is unclear and explaining their own thinking out loud. The goal is to sharpen everyone's understanding, not just get to the right answer.
Students look for patterns and repeated structure to figure out how a problem works before choosing a method to solve it. Recognizing what stays the same across different problems helps students work more efficiently and catch mistakes early.
Students check whether their answer actually makes sense for the situation. That means asking if the number is in the right ballpark, the units fit, and any rounding did not send the answer in the wrong direction.
Students use algebra to work through real problems, like figuring out costs, distances, or rates. The math isn't just practice on paper; it connects to decisions students actually face or will face.
When a math problem gets stuck, students slow down, try a different method, and keep going until something works. They treat wrong turns as part of the process, not a reason to quit.
Students take a real situation (a rising cost, a shrinking population, a cooling cup of coffee) and build a math model that describes it. The goal is a formula or graph that makes the situation easier to analyze and predict.
Students talk through math problems with classmates, asking questions when something is unclear and explaining their own thinking out loud. The goal is sharper understanding, not just a right answer.
Students look for patterns and structure in a problem before diving into the math. Spotting how a problem is put together often reveals a faster or clearer path to the answer.
Students check whether an answer actually makes sense for the situation. That means asking if the number is in the right ballpark, the units fit (miles, dollars, seconds), and any rounding didn't push the result too far off.
Students use algebra to work through real problems: figuring out costs, making predictions, or deciding between options. The math connects to situations outside of class, not just exercises on a page.
Students take a real situation (a shrinking glacier, a growing savings account) and build a math model that describes it: an equation, a graph, or a diagram. The model lets them make predictions or decisions based on actual data.
Students solve problems using methods that are both accurate and efficient. When multiple approaches exist, students choose the one that gets to the answer with less unnecessary work.
Students talk through math problems with classmates, asking questions when something is unclear and explaining their own thinking when others need help.
Students look for patterns and repeated structures to make sense of a problem before solving it. Recognizing how a shape, equation, or diagram is built helps students find a faster or cleaner path to the answer.
Students check whether an answer makes sense in real life. That means asking if a measurement, estimate, or rounded number fits the situation before accepting it as correct.
Students use geometry skills to solve problems they'd actually encounter outside school, like figuring out measurements, layouts, or designs in everyday situations.
Standard
Definition
Code
Mathematical Thinking
Algebra I
When a math problem gets hard, students try a different approach instead of giving up. They look for patterns, rethink what they know, and keep working until they find a path forward.
Students solve problems with practiced efficiency, choosing methods that get to the answer cleanly. The focus is on knowing the steps well enough that the work itself doesn't slow the thinking down.
Students talk through math problems with classmates, asking questions when something is unclear and explaining their own thinking out loud. The goal is to sharpen everyone's understanding, not just get to the right answer.
Students look for patterns and repeated structure to figure out how a problem works before choosing a method to solve it. Recognizing what stays the same across different problems helps students work more efficiently and catch mistakes early.
Students check whether their answer actually makes sense for the situation. That means asking if the number is in the right ballpark, the units fit, and any rounding did not send the answer in the wrong direction.
Students use algebra to work through real problems, like figuring out costs, distances, or rates. The math isn't just practice on paper; it connects to decisions students actually face or will face.
When a math problem gets stuck, students slow down, try a different method, and keep going until something works. They treat wrong turns as part of the process, not a reason to quit.
Students take a real situation (a rising cost, a shrinking population, a cooling cup of coffee) and build a math model that describes it. The goal is a formula or graph that makes the situation easier to analyze and predict.
Students talk through math problems with classmates, asking questions when something is unclear and explaining their own thinking out loud. The goal is sharper understanding, not just a right answer.
Students look for patterns and structure in a problem before diving into the math. Spotting how a problem is put together often reveals a faster or clearer path to the answer.
Students check whether an answer actually makes sense for the situation. That means asking if the number is in the right ballpark, the units fit (miles, dollars, seconds), and any rounding didn't push the result too far off.
Students use algebra to work through real problems: figuring out costs, making predictions, or deciding between options. The math connects to situations outside of class, not just exercises on a page.
Students take a real situation (a shrinking glacier, a growing savings account) and build a math model that describes it: an equation, a graph, or a diagram. The model lets them make predictions or decisions based on actual data.
Students solve problems using methods that are both accurate and efficient. When multiple approaches exist, students choose the one that gets to the answer with less unnecessary work.
Students talk through math problems with classmates, asking questions when something is unclear and explaining their own thinking when others need help.
Students look for patterns and repeated structures to make sense of a problem before solving it. Recognizing how a shape, equation, or diagram is built helps students find a faster or cleaner path to the answer.
Students check whether an answer makes sense in real life. That means asking if a measurement, estimate, or rounded number fits the situation before accepting it as correct.
Students use geometry skills to solve problems they'd actually encounter outside school, like figuring out measurements, layouts, or designs in everyday situations.
Students write and solve equations that use a straight line or an inequality to describe a real situation, like figuring out how many hours to work to hit a savings goal. They also graph those equations to make the pattern visible.
Students write pairs of equations or inequalities with two unknowns, then solve them to find values that satisfy both at once. This shows up when two conditions, like cost and quantity, must both be true.
Students examine the shape, vertex, and direction of parabolas to understand how they behave. They then use those patterns to model real situations, like the arc of a ball or the area of a rectangle.
Students learn to recognize when something grows or shrinks by a steady percentage over time, like a savings account earning interest or a car losing value, and write a math rule that predicts future amounts.
Students add, subtract, multiply, and factor expressions with variables and exponents, like (x + 3)(x - 2), to solve problems. This is the algebra behind area, profit, and other real-world formulas.
Standard
Definition
Code
Linear Equations
Algebra I
Students write and solve equations that use a straight line or an inequality to describe a real situation, like figuring out how many hours to work to hit a savings goal. They also graph those equations to make the pattern visible.
Students write pairs of equations or inequalities with two unknowns, then solve them to find values that satisfy both at once. This shows up when two conditions, like cost and quantity, must both be true.
Students examine the shape, vertex, and direction of parabolas to understand how they behave. They then use those patterns to model real situations, like the arc of a ball or the area of a rectangle.
Students learn to recognize when something grows or shrinks by a steady percentage over time, like a savings account earning interest or a car losing value, and write a math rule that predicts future amounts.
Students add, subtract, multiply, and factor expressions with variables and exponents, like (x + 3)(x - 2), to solve problems. This is the algebra behind area, profit, and other real-world formulas.
Students write and solve equations that use a straight line or an inequality to describe a real situation, like figuring out how many hours to work to hit a savings goal. They also graph those equations to make the pattern visible.
Students write pairs of equations or inequalities with two unknowns, then solve them to find values that satisfy both at once. This shows up when two conditions, like cost and quantity, must both be true.
Students examine the shape, vertex, and direction of parabolas to understand how they behave. They then use those patterns to model real situations, like the arc of a ball or the area of a rectangle.
Students learn to recognize when something grows or shrinks by a steady percentage over time, like a savings account earning interest or a car losing value, and write a math rule that predicts future amounts.
Students add, subtract, multiply, and factor expressions with variables and exponents, like (x + 3)(x - 2), to solve problems. This is the algebra behind area, profit, and other real-world formulas.
Standard
Definition
Code
Linear Equations
Algebra I
Students write and solve equations that use a straight line or an inequality to describe a real situation, like figuring out how many hours to work to hit a savings goal. They also graph those equations to make the pattern visible.
Students write pairs of equations or inequalities with two unknowns, then solve them to find values that satisfy both at once. This shows up when two conditions, like cost and quantity, must both be true.
Students examine the shape, vertex, and direction of parabolas to understand how they behave. They then use those patterns to model real situations, like the arc of a ball or the area of a rectangle.
Students learn to recognize when something grows or shrinks by a steady percentage over time, like a savings account earning interest or a car losing value, and write a math rule that predicts future amounts.
Students add, subtract, multiply, and factor expressions with variables and exponents, like (x + 3)(x - 2), to solve problems. This is the algebra behind area, profit, and other real-world formulas.
Reading a graph tells you what a function is actually doing. Students study the shapes, peaks, valleys, and patterns of five major function families to predict behavior, find key features, and explain what the graph shows.
Students add, subtract, multiply, and divide expressions that include variables raised to powers or written as fractions. They also solve equations built from those expressions.
Students write and graph exponential and logarithmic functions, then use those functions to model real situations like population growth or the decay of a radioactive element.
Students write formulas for number patterns that either grow by adding the same amount each step or by multiplying by the same amount. They use those formulas to solve real problems, like predicting future values or finding a running total.
Students use a circle with radius 1 to understand how sine, cosine, and tangent repeat in predictable patterns. They apply those patterns to model real situations, like sound waves or seasonal temperature changes.
Students use bell-curve data and confidence intervals to draw conclusions from real-world numbers, like survey results or test scores. The focus is on making reasonable predictions, not just reading a graph.
Standard
Definition
Code
Functions and Their Graphs
Algebra II
Reading a graph tells you what a function is actually doing. Students study the shapes, peaks, valleys, and patterns of five major function families to predict behavior, find key features, and explain what the graph shows.
Students add, subtract, multiply, and divide expressions that include variables raised to powers or written as fractions. They also solve equations built from those expressions.
Students write and graph exponential and logarithmic functions, then use those functions to model real situations like population growth or the decay of a radioactive element.
Students write formulas for number patterns that either grow by adding the same amount each step or by multiplying by the same amount. They use those formulas to solve real problems, like predicting future values or finding a running total.
Students use a circle with radius 1 to understand how sine, cosine, and tangent repeat in predictable patterns. They apply those patterns to model real situations, like sound waves or seasonal temperature changes.
Students use bell-curve data and confidence intervals to draw conclusions from real-world numbers, like survey results or test scores. The focus is on making reasonable predictions, not just reading a graph.
Reading a graph tells you what a function is actually doing. Students study the shapes, peaks, valleys, and patterns of five major function families to predict behavior, find key features, and explain what the graph shows.
Students add, subtract, multiply, and divide expressions that include variables raised to powers or written as fractions. They also solve equations built from those expressions.
Students write and graph exponential and logarithmic functions, then use those functions to model real situations like population growth or the decay of a radioactive element.
Students write formulas for number patterns that either grow by adding the same amount each step or by multiplying by the same amount. They use those formulas to solve real problems, like predicting future values or finding a running total.
Students use a circle with radius 1 to understand how sine, cosine, and tangent repeat in predictable patterns. They apply those patterns to model real situations, like sound waves or seasonal temperature changes.
Students use bell-curve data and confidence intervals to draw conclusions from real-world numbers, like survey results or test scores. The focus is on making reasonable predictions, not just reading a graph.
Standard
Definition
Code
Functions and Their Graphs
Algebra II
Reading a graph tells you what a function is actually doing. Students study the shapes, peaks, valleys, and patterns of five major function families to predict behavior, find key features, and explain what the graph shows.
Students add, subtract, multiply, and divide expressions that include variables raised to powers or written as fractions. They also solve equations built from those expressions.
Students write and graph exponential and logarithmic functions, then use those functions to model real situations like population growth or the decay of a radioactive element.
Students write formulas for number patterns that either grow by adding the same amount each step or by multiplying by the same amount. They use those formulas to solve real problems, like predicting future values or finding a running total.
Students use a circle with radius 1 to understand how sine, cosine, and tangent repeat in predictable patterns. They apply those patterns to model real situations, like sound waves or seasonal temperature changes.
Students use bell-curve data and confidence intervals to draw conclusions from real-world numbers, like survey results or test scores. The focus is on making reasonable predictions, not just reading a graph.
Students use the basic rules of geometry, like how two points define a line or how three points define a plane, to build logical arguments and explain why geometric statements are true.
Rigid transformations move, flip, or rotate a shape without changing its size or angles. Students use these moves to explain why two shapes are identical and to solve geometry problems.
Students use scale factors and angle-based ratios to find missing side lengths and angles in right triangles. This includes setting up proportions from similar triangles and applying sine, cosine, and tangent to real measurements.
Students find the area and perimeter of shapes like triangles, rectangles, and circles. They also identify key properties, such as side lengths and angles, that define each shape.
Students find the total area covering the outside of a solid shape, like a box or a cone, and calculate how much space that shape holds inside. This applies to prisms, cylinders, pyramids, and spheres.
Students plot points and draw shapes on a graph, then use coordinates to prove or disprove geometric relationships like parallelism, congruence, or distance. The grid becomes a tool for checking whether a geometric argument holds up.
Students calculate the odds of two or more events happening together, sometimes using area or other geometric measurements to figure out how likely an outcome is.
Standard
Definition
Code
Foundations of Geometry
Geometry
Students use the basic rules of geometry, like how two points define a line or how three points define a plane, to build logical arguments and explain why geometric statements are true.
Rigid transformations move, flip, or rotate a shape without changing its size or angles. Students use these moves to explain why two shapes are identical and to solve geometry problems.
Students use scale factors and angle-based ratios to find missing side lengths and angles in right triangles. This includes setting up proportions from similar triangles and applying sine, cosine, and tangent to real measurements.
Students find the area and perimeter of shapes like triangles, rectangles, and circles. They also identify key properties, such as side lengths and angles, that define each shape.
Students find the total area covering the outside of a solid shape, like a box or a cone, and calculate how much space that shape holds inside. This applies to prisms, cylinders, pyramids, and spheres.
Students plot points and draw shapes on a graph, then use coordinates to prove or disprove geometric relationships like parallelism, congruence, or distance. The grid becomes a tool for checking whether a geometric argument holds up.
Students calculate the odds of two or more events happening together, sometimes using area or other geometric measurements to figure out how likely an outcome is.
Students use the basic rules of geometry, like how two points define a line or how three points define a plane, to build logical arguments and explain why geometric statements are true.
Rigid transformations move, flip, or rotate a shape without changing its size or angles. Students use these moves to explain why two shapes are identical and to solve geometry problems.
Students use scale factors and angle-based ratios to find missing side lengths and angles in right triangles. This includes setting up proportions from similar triangles and applying sine, cosine, and tangent to real measurements.
Students find the area and perimeter of shapes like triangles, rectangles, and circles. They also identify key properties, such as side lengths and angles, that define each shape.
Students find the total area covering the outside of a solid shape, like a box or a cone, and calculate how much space that shape holds inside. This applies to prisms, cylinders, pyramids, and spheres.
Students plot points and draw shapes on a graph, then use coordinates to prove or disprove geometric relationships like parallelism, congruence, or distance. The grid becomes a tool for checking whether a geometric argument holds up.
Students calculate the odds of two or more events happening together, sometimes using area or other geometric measurements to figure out how likely an outcome is.
Standard
Definition
Code
Foundations of Geometry
Geometry
Students use the basic rules of geometry, like how two points define a line or how three points define a plane, to build logical arguments and explain why geometric statements are true.
Rigid transformations move, flip, or rotate a shape without changing its size or angles. Students use these moves to explain why two shapes are identical and to solve geometry problems.
Students use scale factors and angle-based ratios to find missing side lengths and angles in right triangles. This includes setting up proportions from similar triangles and applying sine, cosine, and tangent to real measurements.
Students find the area and perimeter of shapes like triangles, rectangles, and circles. They also identify key properties, such as side lengths and angles, that define each shape.
Students find the total area covering the outside of a solid shape, like a box or a cone, and calculate how much space that shape holds inside. This applies to prisms, cylinders, pyramids, and spheres.
Students plot points and draw shapes on a graph, then use coordinates to prove or disprove geometric relationships like parallelism, congruence, or distance. The grid becomes a tool for checking whether a geometric argument holds up.
Students calculate the odds of two or more events happening together, sometimes using area or other geometric measurements to figure out how likely an outcome is.
NAEP (National Assessment of Educational Progress)
Federally administered sample-based assessment in reading, mathematics, science, and writing. NAEP results inform state-by-state comparisons rather than individual student or school accountability.
Students work with three main families of equations: lines, parabolas, and exponential growth or decay. They learn to write each one from a real situation, solve it, and graph it. They also add, subtract, multiply, and factor polynomials.
How can I help with algebra homework if I don't remember any of this?
Ask students to explain what the letters and numbers stand for in a problem before solving. If they can tell a short story about what x means, the rest usually gets easier. Checking whether the answer is a reasonable size is also useful.
What should I look for to know algebra is going well?
Watch for students solving simple equations without writing every step, and for them catching their own mistakes when an answer looks too big or too small. Sketching a quick graph to check work is another good sign.
How should I sequence the year?
Most teachers start with linear equations and inequalities, move into systems, then spend a long block on quadratics including factoring polynomials. Exponential functions usually come near the end so students can compare linear, quadratic, and exponential growth side by side.
Which topics usually need the most reteaching?
Factoring quadratics and solving systems tend to take the longest to stick. Students also struggle to tell when a situation is linear versus exponential. Building in spiral review of these three throughout the year saves time in the spring.
Does my student need to memorize formulas?
A few are worth knowing cold, like the quadratic formula and slope. Most of the work is about choosing the right tool for the situation, not reciting rules. Repeated practice with mixed problem sets matters more than flashcards.
What does mastery look like by the end of the year?
Students can take a word problem, decide whether it is linear, quadratic, or exponential, write the equation, solve it, and check the answer against the context. They can also factor common quadratics and graph each function family by hand.
How do I know my student is ready for Geometry or the next math course?
Strong readiness means solving multi-step equations confidently, working with negative numbers and fractions without slowing down, and reading a graph to pull out real information. Gaps in these areas are worth shoring up over the summer.
How much real-world modeling should I include?
Aim for at least one modeling task per unit where students build the equation from a situation rather than receiving it. This is where the reasoning standards live, and it is what end-of-course questions tend to assess.